
Working with dates is at the heart of most business reporting and analytics. Whether you’re tracking sales over time, comparing month-over-month performance, or calculating year-to-date metrics, you’re dealing with time intelligence—and for that, a robust and well-structured Date Table is essential.
However, many Power BI developers (even experienced ones) unintentionally make mistakes when implementing or using Date Tables. These missteps often lead to:
- Incorrect results in DAX measures,
- Misleading visuals,
- Performance bottlenecks, or
- Inability to meet business requirements like fiscal calendars or rolling periods.
In this blog, we’ll explore the Top 5 most common mistakes people make with Date Tables in Power BI. For each one, I’ll provide a real-world scenario, explain the impact, and share best practices with examples.
Mistake #1: Not Using a Dedicated Date Table
Scenario:
You connect Power BI to your Sales table, which already contains an OrderDate column. You rely on Power BI’s auto-generated date hierarchy for visuals.
What Goes Wrong:
Power BI silently creates an Auto Date/Time table behind the scenes for each date column you use. This works in simple cases, but:
- You can’t customize the calendar (e.g., fiscal year, week starts on Monday, holidays).
- You cannot join it to other tables (e.g., Inventory, Budget) using shared dimensions.
- DAX functions like TOTALYTD, PARALLELPERIOD, or SAMEPERIODLASTYEAR won’t work consistently.
Best Practice:
Create a dedicated Date Table that spans the required range and includes the attributes your business needs—like Year, Quarter, Month, Fiscal Week, Day of Week, etc.
Here’s a DAX example:
					DateTable =
ADDCOLUMNS(
    CALENDAR(DATE(2018, 1, 1), DATE(2026, 12, 31)),
    "Year", YEAR([Date]),
    "Month", FORMAT([Date], "MMMM"),
    "MonthNumber", MONTH([Date]),
    "Quarter", "Q" & FORMAT([Date], "Q"),
    "Weekday", FORMAT([Date], "dddd"),
    "FiscalYear", IF(MONTH([Date]) > 6, YEAR([Date]) + 1, YEAR([Date]))
)
After that, go to Model view > Mark as Date Table and select the [Date] column.
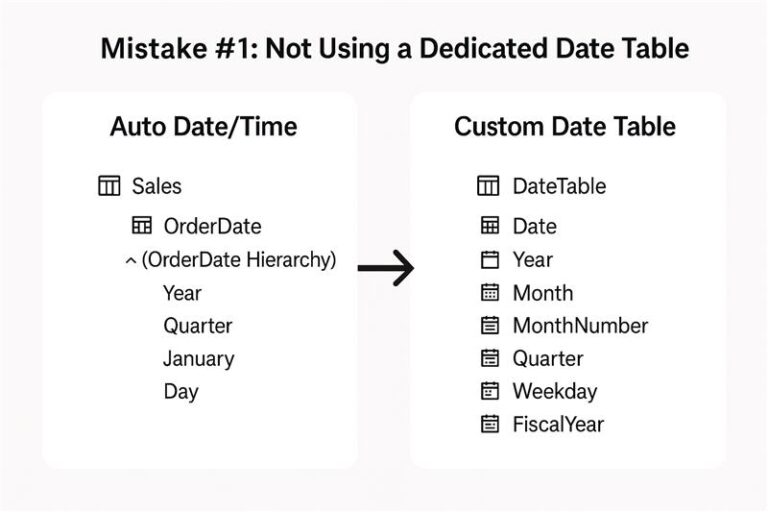
Not Using a Dedicated Date Table. It visually contrasts the Auto Date/Time hierarchy with a Custom Date Table that includes essential attributes like Year, Month, MonthNumber, Quarter, Weekday, and FiscalYear.
Mistake #2: Not Creating Proper Relationships Between the Date Table and Fact Tables
Scenario:
You build a great Date Table, but forget to link it to your Sales table using OrderDate.
What Goes Wrong:
Your slicers and visuals that rely on dates don’t behave correctly. Time-based filters (like filtering by Year or Quarter) don’t affect the sales data.
Best Practice:
Create a one-to-many relationship from DateTable[Date] to Sales[OrderDate]. The Date Table should be on the “one” side and must have no duplicate or blank values.
Always make sure your date column is a true date data type—not text or datetime with timestamps.
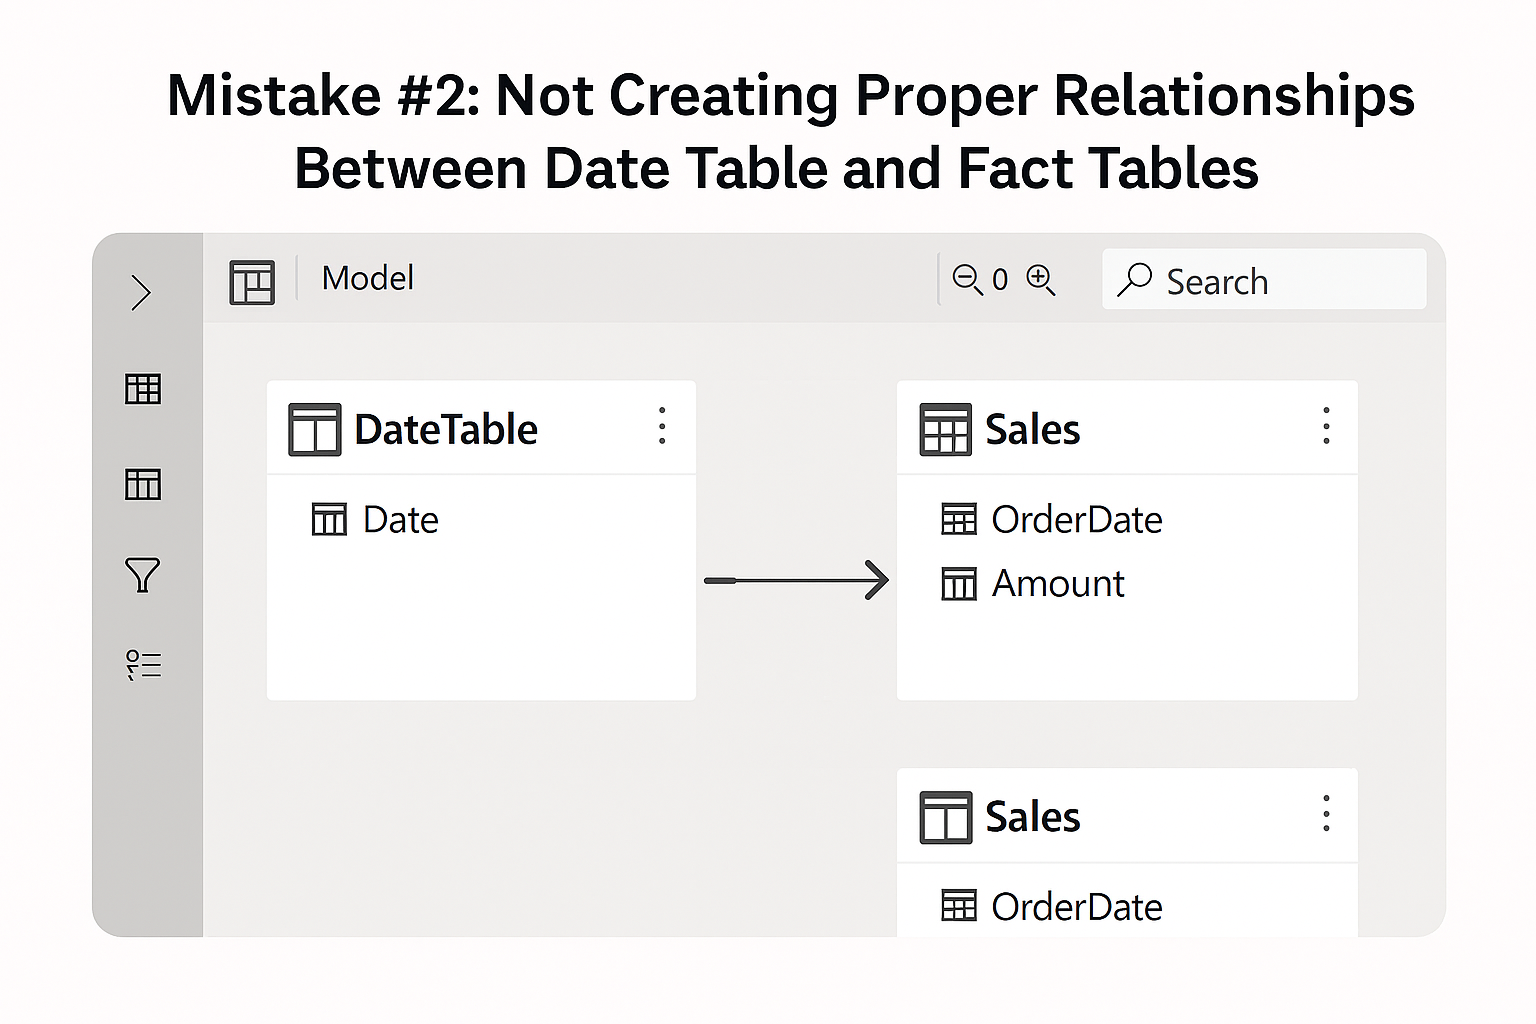
Not Creating Proper Relationships Between the Date Table and Fact Tables. It shows the correct one-to-many relationship from DateTable[Date] to Sales[OrderDate] in Power BI’s Model view.
Mistake #3: Using Incomplete or Gapped Date Ranges
Scenario:
Your Sales table starts in March 2022, so you generate a Date Table only from that date onwards. Later, when analyzing YoY trends, missing months and years become an issue.
What Goes Wrong:
Your visuals only show months with data. Empty periods (e.g., January or February) are missing. Trend lines are broken. This gives the illusion of inactivity—even when it’s just missing data, not missing sales.
Best Practice:
Build a continuous date range in your Date Table that covers:
- Your earliest historical data
- Your future forecast range
A good rule of thumb: Go at least 3–5 years in both directions from your current year.
This ensures that empty periods appear as zeros in visuals, which is critical for accurate trend reporting, forecasting, and variance analysis.
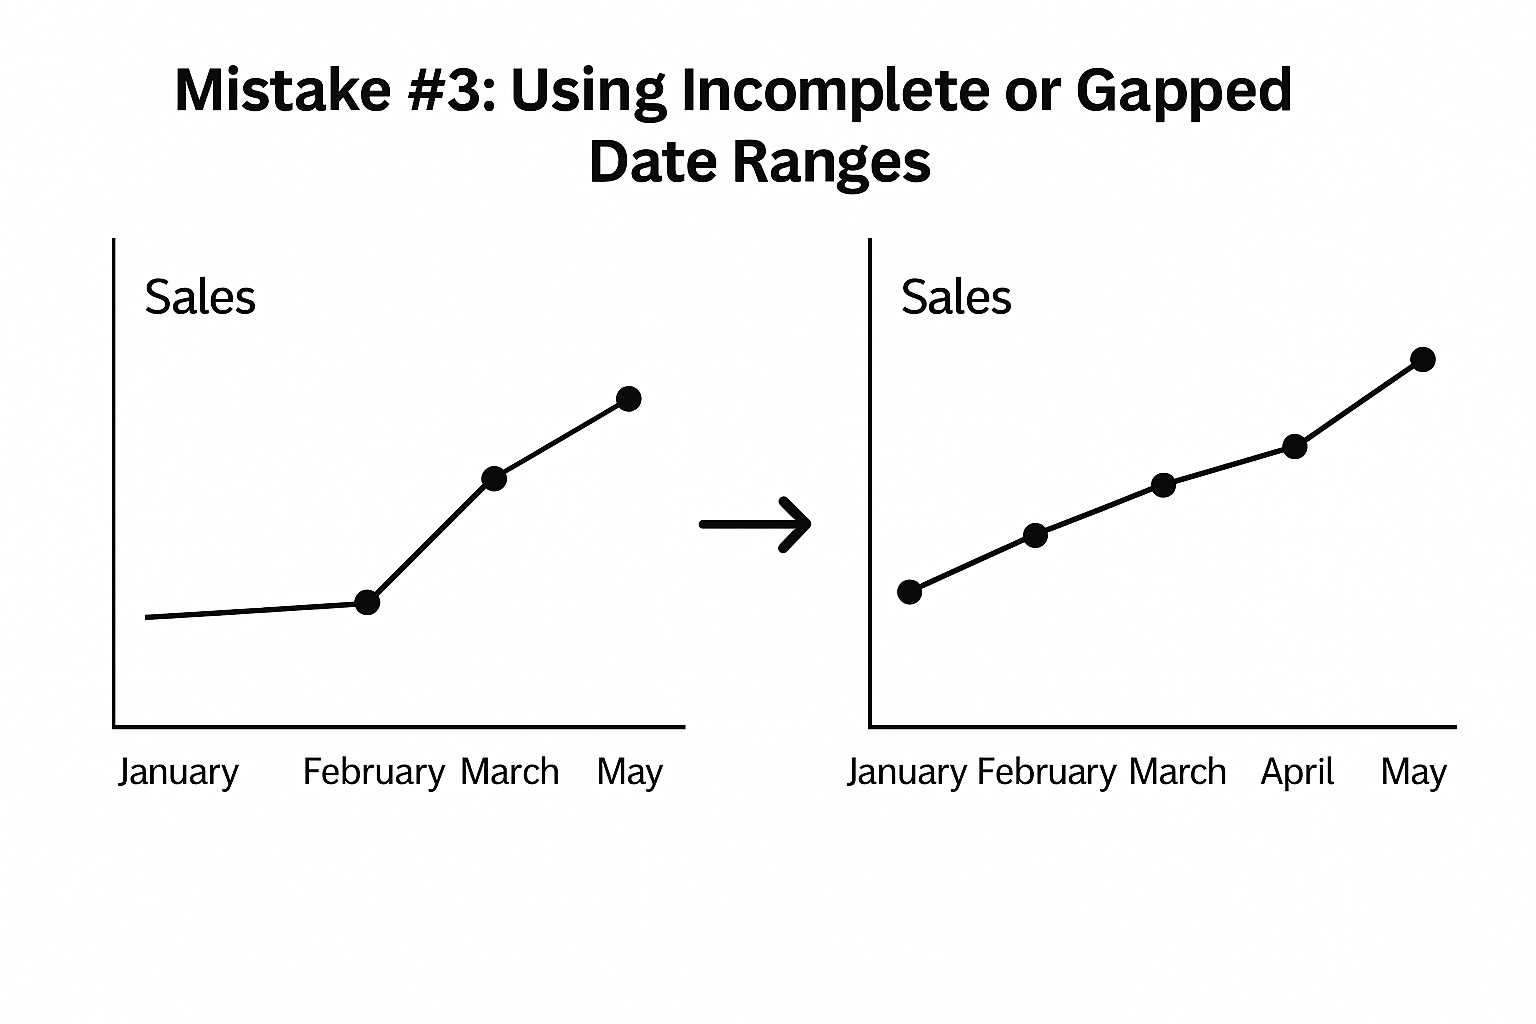
Using Incomplete or Gapped Date Ranges. It shows the difference between a broken trend line (missing months) and a continuous trend line with all months included.
Mistake #4: Not Marking the Table as a Date Table
Scenario:
You build your own Date Table with DAX or import one from Excel, but forget to mark it properly in Power BI.
What Goes Wrong:
Time intelligence functions in DAX (like SAMEPERIODLASTYEAR, DATESYTD, or PARALLELPERIOD) won’t recognize the table. Your calculations either break or return incorrect values.
Best Practice:
After creating the Date Table, go to:
- Model View
- Right-click your Date Table
- Choose “Mark as Date Table”
- Select the [Date] column
This step is mandatory if you want to use any time-based DAX functions reliably.
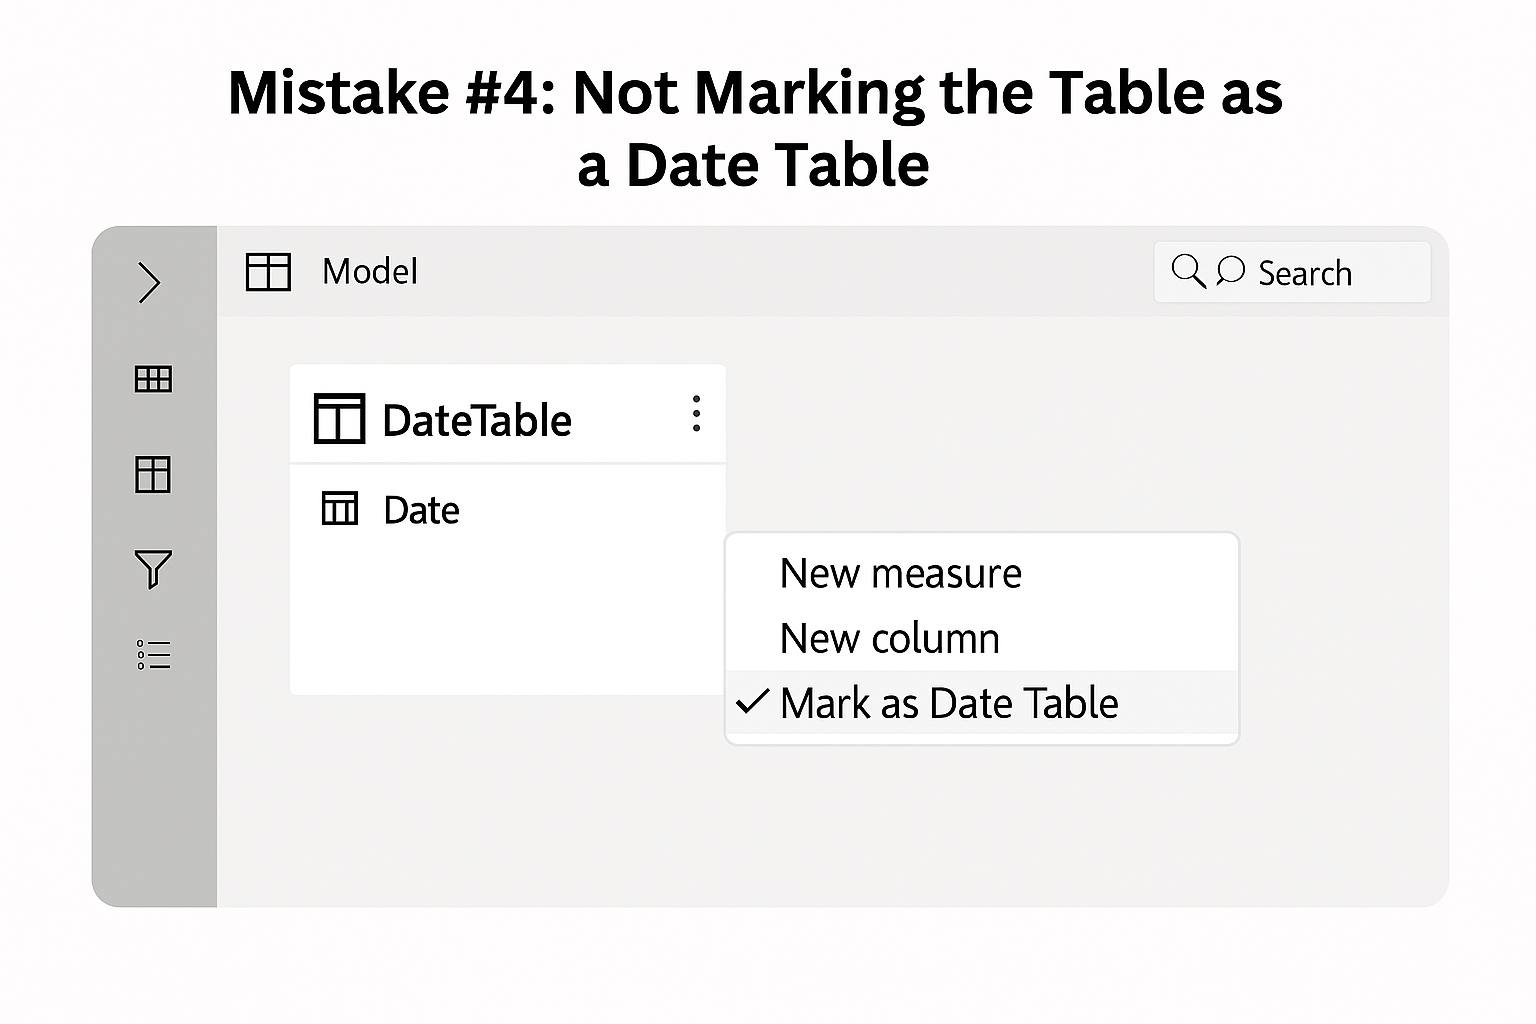
Not Marking the Table as a Date Table. It highlights the Power BI option “Mark as Date Table” in the Model view.
Mistake #5: Ignoring Role-Playing Dimensions (Multiple Date Columns)
Scenario:
Your Sales table has:
- OrderDate
- ShipDate
- DeliveryDate
You only create a relationship using OrderDate, but stakeholders want to analyze metrics by Ship Date or Delivery Date as well.
What Goes Wrong:
You can’t use time slicers or comparisons for those other date columns. Power BI only allows one active relationship between two tables.
Best Practice:
Create role-playing dimensions by duplicating the Date Table:
- Duplicate the Date Table and rename it to ShipDateTable, DeliveryDateTable, etc.
- Create separate relationships from these new tables to the appropriate date columns.
- Use USERELATIONSHIP() in DAX when needed to switch contexts.
Example:
This allows full flexibility for building reports by different types of dates.
					TotalShipped =

CALCULATE(

    SUM(Sales[Amount]),

    USERELATIONSHIP(Sales[ShipDate], ShipDateTable[Date])

)
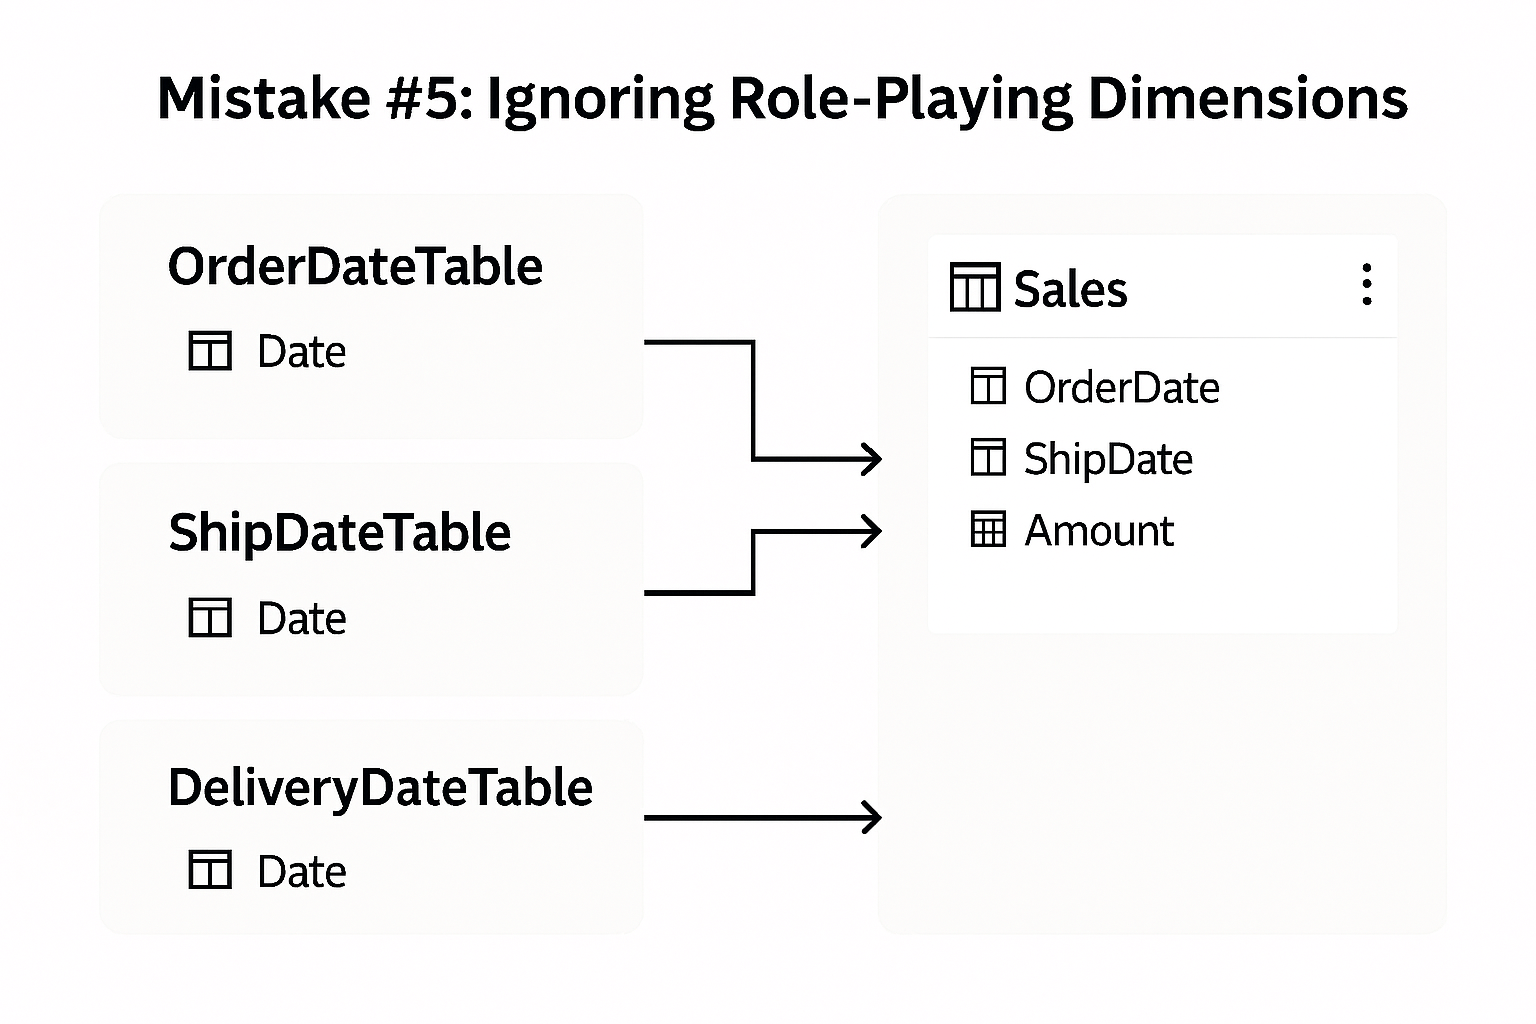
Ignoring Role-Playing Dimensions. It illustrates multiple Date Tables (OrderDateTable, ShipDateTable, DeliveryDateTable) connected to different date columns in the Sales table.
Quick Tips for Better Date Tables
- Sort Months Properly: Use a MonthNumber column to sort month names (so visuals show Jan, Feb, Mar—not April, August, December…).
- Avoid Duplicate Dates: Make sure your [Date] column has no duplicates and no blank values.
- Pre-calculate Flags: Add columns like [IsCurrentMonth], [IsWeekend], or [IsHoliday] in advance for filtering logic in reports.
Well-Structured Date Table
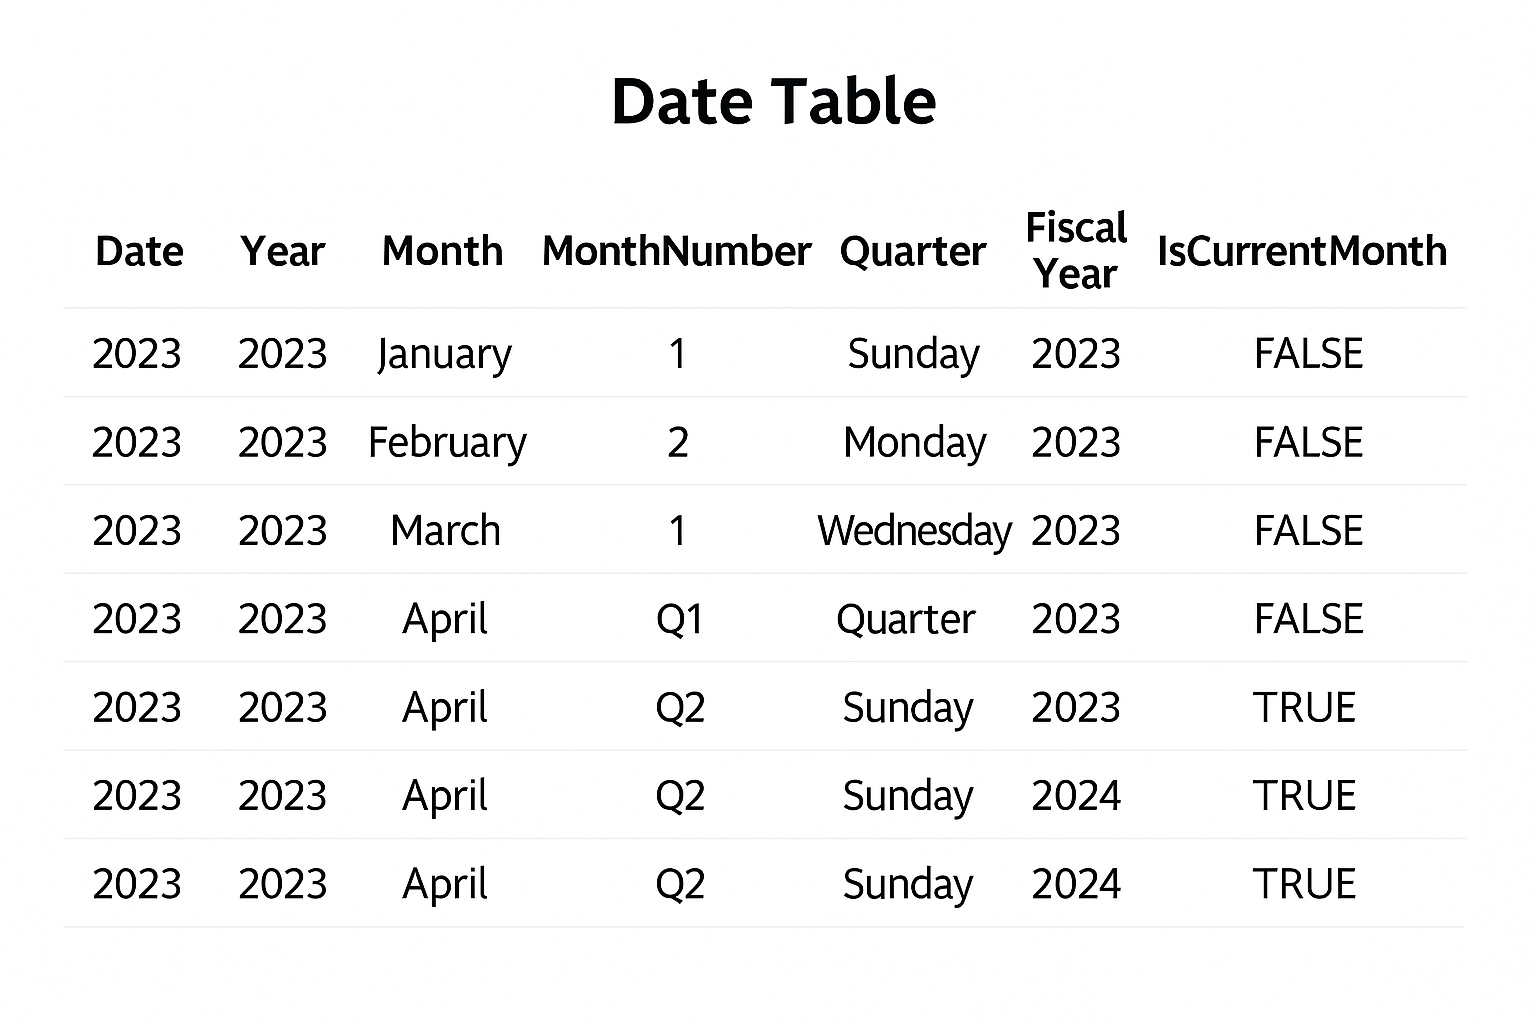
Here’s the well-structured Date Table with columns like:
- Date
- Year
- Month
- Month Number
- Quarter
- Fiscal Year
- IsCurrentMonth.
Final Thoughts
In Power BI, the Date Table isn’t just a utility—it’s the foundation of every report that involves time. Done right, it enables:
- Accurate insights
- Reliable calculations
- Seamless interactivity
Avoid these five mistakes, and you’ll immediately level up your Power BI models for time intelligence and beyond.