Building AI agents with LangGraph and foundation models is relatively straightforward today. You can create a sophisticated multi-agent system that orchestrates complex workflows, reasons through problems, and delivers intelligent responses within hours. However, here’s the sobering reality: 87% of AI projects never make it to production, and governance challenges are among the top reasons why.
When you deploy agents to production, you’re not just shipping code—you’re deploying systems that make autonomous decisions, access sensitive data, consume resources, and directly impact business outcomes. Without proper governance, tracing, and monitoring, you’re essentially flying blind. How do you know if your agent is providing accurate responses? How do you debug failures? How do you ensure compliance? How do you track costs and optimize performance?
This is where Databricks’ comprehensive governance and observability infrastructure becomes mission-critical. In this article, we’ll explore how Databricks provides enterprise-grade agent governance through Unity Catalog, MLflow tracing, inference monitoring, LLM-as-a-Judge evaluation, and data lineage—turning experimental agents into production-ready, auditable, and continuously improving systems.
Understanding Agent Governance: Beyond Traditional ML Monitoring
Agent governance refers to the comprehensive framework for managing, monitoring, auditing, and controlling AI agents throughout their lifecycle—from development through production deployment. Unlike traditional ML models that make single predictions, agents are complex systems that chain multiple operations, make sequential decisions, call external tools, and maintain conversational state.
This complexity introduces unique governance challenges:
- Multi-step execution transparency: How do you track what happened across 10+ steps in an agent’s reasoning chain?
- Dynamic decision auditing: How do you verify that an agent made appropriate choices when routing between sub-agents or tools?
- Cost attribution: With foundation models charging per token, how do you track costs across different agent components?
- Quality assessment: How do you evaluate whether a 500-word analytical response is correct, relevant, and grounded in data?
- Data access control: How do you ensure agents only access data they’re authorized to use?
Traditional ML monitoring tools fall short because they weren’t designed for agentic workflows. Databricks addresses this with an integrated platform approach.
Key Concepts
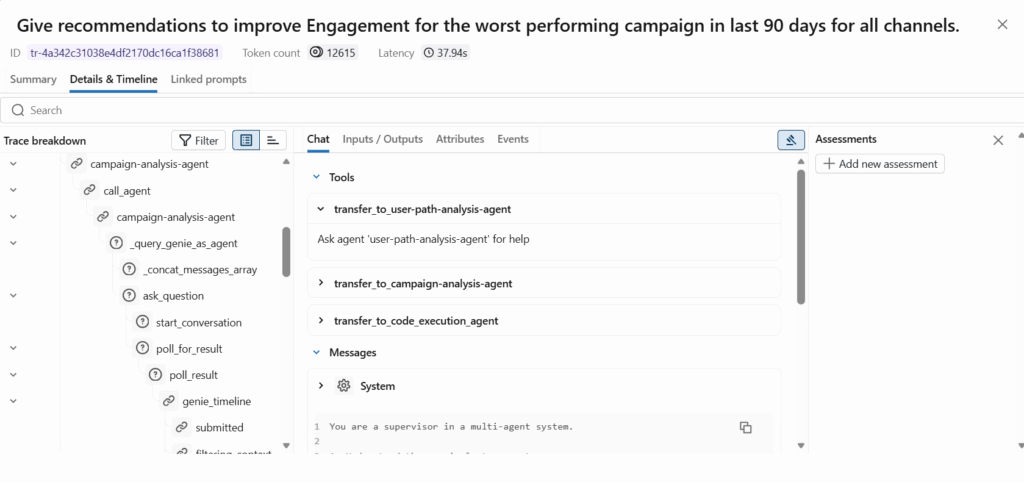
MLflow Tracing provides end-to-end observability by capturing every step of your agent’s execution, including inputs, outputs, intermediate reasoning, tool calls, latency, and token usage. MLflow Tracing delivers comprehensive observability for production AI agents by recording execution details that can be viewed through the MLflow UI or analyzed as tables.
Unity Catalog serves as your centralized governance layer, managing access control, auditing, and lineage for all data and AI assets. Unity Catalog provides built-in auditing and lineage capabilities, automatically capturing user-level audit logs that record access to your data.
Unity Catalog Model Registry extends governance to AI agents themselves, enabling enhanced governance with access policies and permission controls, cross-workspace access, and tracking which notebooks, datasets, and experiments were used to create each model.
LLM-as-a-Judge is an automated evaluation approach where large language models assess the quality of agent outputs based on criteria like correctness, relevance, and safety. LLM Judges leverage the reasoning capabilities of LLMs to make quality assessments, acting as AI assistants specialized in quality evaluation.
Inference Tables automatically capture and log all requests and responses from serving endpoints into Unity Catalog Delta tables. Inference tables simplify monitoring and diagnostics by continuously logging serving request inputs and responses from Model Serving endpoints.

Implementing Enterprise Agent Governance: A Step-by-Step Framework
Step 1: Enable Comprehensive MLflow Tracing
MLflow Tracing is your foundation for agent observability. It captures every detail of agent execution automatically.
Automatic Tracing Setup:
					import mlflow

# Enable automatic tracing for supported libraries
mlflow.langchain.autolog()  # For LangChain agents
mlflow.openai.autolog()     # For OpenAI calls
# Set tracking to Databricks managed MLflow
mlflow.set_tracking_uri("databricks")
mlflow.set_experiment("/Shared/agent-experiments")
When you deploy agents instrumented with MLflow Tracing through the Mosaic AI Agent Framework, tracing works automatically without additional configuration, with traces stored in the agent’s MLflow experiment.
What Gets Traced:
Every trace captures:
- Complete input prompts and user queries
- All intermediate reasoning steps
- Tool and function calls with arguments and results
- Sub-agent routing decisions
- Token counts (input and output) per operation
- Execution latency for each step
- Final agent response
- Error messages and stack traces
Production Tracing to Delta Tables:
For production deployments, traces can be logged to Delta tables using production monitoring, with traces syncing every 15 minutes and supporting unlimited trace sizes.
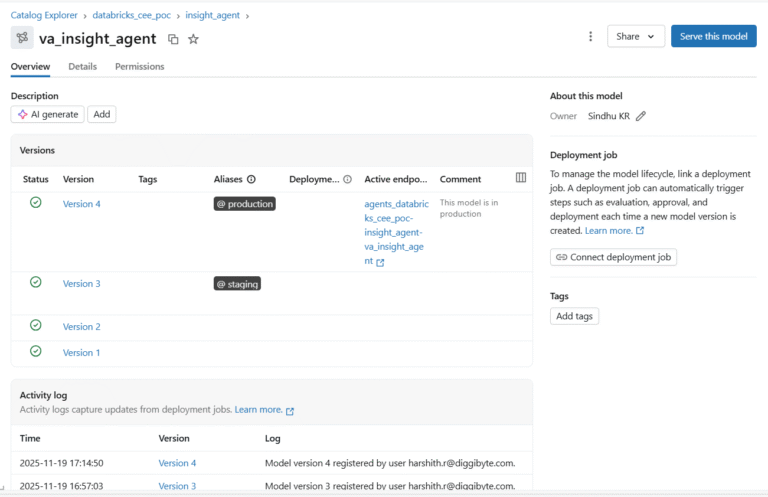
Step 2: Register Agents in Unity Catalog Model Registry
Unity Catalog Model Registry brings enterprise governance to your agents with versioning, access control, and lineage.
Register Your Agent:
					import mlflow

# Log your LangGraph agent as an MLflow model
with mlflow.start_run():
    logged_model = mlflow.langchain.log_model(
        lc_model=agent,
        artifact_path="agent",
        registered_model_name="catalog.schema.insight_agent",
        input_example={"query": "Analyze campaign performance"}
    )
Key Governance Features:
Feature | Description | Business Value |
Version Control | Every agent iteration is versioned automatically | Rollback capability, A/B testing, audit trail |
Access Control | Fine-grained permissions (Owner, Can Manage, Can Use) | Security compliance, team collaboration |
Cross-Workspace Access | Register once, deploy across multiple workspaces | Consistency, reduced duplication |
Model Aliases | Tag versions (e.g., @champion, @staging) | Production promotion workflows |
Audit Logging | All access and modifications logged | Compliance, security investigation |
Track Data Lineage:
When you train a model on a Unity Catalog table, you can track lineage to upstream datasets using mlflow.log_input, which saves input table information with the MLflow run.
					# Log dataset lineage
dataset = mlflow.data.from_spark(
    df=training_data,
    table_name="catalog.schema.campaign_metrics"
)

with mlflow.start_run():
    mlflow.log_input(dataset, context="training")
    # Train and log model
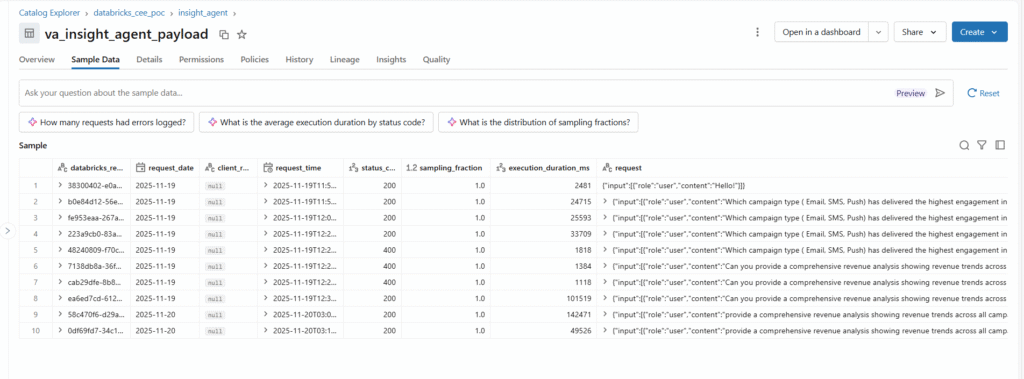
Step 3: Enable Inference Tables for Production Monitoring
Inference tables automatically log every production request and response into Unity Catalog.
Enable During Endpoint Creation:
					from databricks.sdk import WorkspaceClient
from databricks.sdk.service.serving mport EndpointCoreConfigInput

w = WorkspaceClient()

w.serving_endpoints.create(
    name="insight_agent_endpoint",
    config=EndpointCoreConfigInput(
        served_entities=[
            {
                "entity_name": "catalog.schema.insight_agent",
                "entity_version": "4",
                "workload_size": "Small",
                "scale_to_zero_enabled": True
            }
        ],
        # Enable inference table logging
        auto_capture_config={
            "catalog_name": "catalog",
            "schema_name": "monitoring",
            "table_name_prefix": "insight_agent",
            "enabled": True
        }
    )
)
What Gets Logged:
The inference table captures comprehensive execution metadata:
Field | Description | Use Case |
databricks_request_id | Unique request identifier | Debugging, trace correlation |
request_timestamp | When the request was received | Time-series analysis |
status_code | HTTP response status | Error rate monitoring |
execution_duration_ms | Total latency | Performance optimization |
request_payload | Complete input (prompts, messages) | Quality analysis, replay |
response_payload | Complete agent output | Evaluation, fine-tuning data |
token_count_input | Input tokens consumed | Cost tracking |
token_count_output | Output tokens generated | Cost attribution |
requester | User/service identity | Usage analysis, auditing |
mlflow_trace_id | Link to detailed trace | Deep debugging |
Query Inference Data:
					-- Analyze agent performance
SELECT
    DATE(request_timestamp) as date,
    COUNT(*) as total_requests,
    AVG(execution_duration_ms) as avg_latency_ms,
    SUM(token_count_input + token_count_output) as total_tokens,
    SUM(CASE WHEN status_code = 200 THEN 1 ELSE 0 END) / COUNT(*) as success_rate
FROM catalog.monitoring.insight_agent_payload
GROUP BY date
ORDER BY date DESC;
Step 4: Implement LLM-as-a-Judge for Quality Evaluation
Manual evaluation doesn’t scale. LLM-as-a-Judge provides automated, consistent quality assessment.
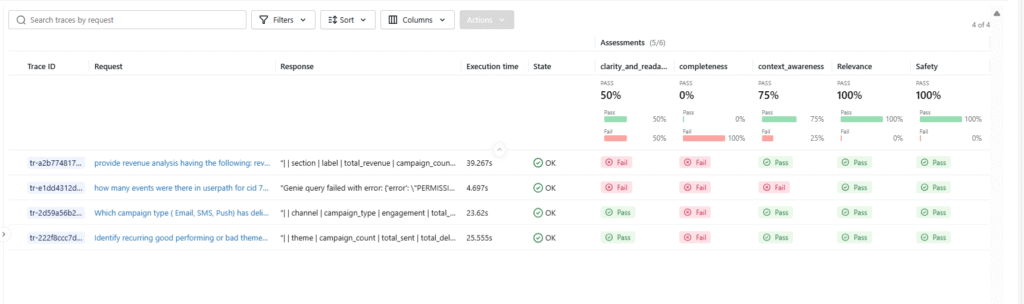
Built-in Judges:
Databricks provides research-backed judges for common evaluation criteria:
Judge | Purpose | When to Use |
correctness | Answer accuracy vs ground truth | When you have reference answers |
relevance_to_query | Response addresses the question | All agent responses |
groundedness | Response grounded in the provided context | RAG applications |
safety | No harmful/inappropriate content | User-facing applications |
chunk_relevance | Retrieved context is relevant | Retrieval systems |
guideline_adherence | Follows specified guidelines | Domain-specific requirements |
Create Evaluation Dataset:
					import pandas as pd
# Build evaluation set from production data or curated examples
eval_data = pd.DataFrame([
    {
        "request": "What drove the CTR increase in email campaigns?",
        "response": "Email CTR increased 15% due to improved subject line testing and audience segmentation",
        "expected_facts": [
            "CTR increased by 15%",
            "Improvement due to subject line testing and segmentation"
        ]
    },
    {
        "request": "Analyze user drop-off in the checkout funnel",
        "response": "Analysis shows 40% drop-off at payment page due to limited payment options",
        "expected_facts": [
            "40% drop-off at payment page",
            "Cause identified as limited payment options"
        ]
    }
])
Run Automated Evaluation:
					import mlflow

# Evaluate agent with built-in judges
results = mlflow.evaluate(
    data=eval_data,
    model_type="databricks-agent",
    evaluator_config={
        "databricks-agent": {
            "metrics": [
                "correctness",
                "relevance_to_query",
                "groundedness"
            ]
        }
    }
)

# View results
results.tables['eval_results'].display()
Custom Judge for Domain-Specific Criteria:
With the make_judge SDK introduced in MLflow 3.4.0, you can create custom LLM judges using natural language instructions rather than complex programmatic logic.
					from mlflow.metrics.genai import make_genai_metric_from_prompt
# Define custom evaluation criteria
business_impact_prompt = """
Evaluate if the agent's response quantifies business impact.
A good response includes specific metrics, percentages, or dollar amounts.
Input: {input}
Response: {response}
Provide a score from 1-5 where:
5 = Clear quantified impact with specific numbers
3 = Directional impact without specific quantification
1 = No business impact discussed
Return JSON: {{"score": <int>, "rationale": "<explanation>"}}
"""
business_impact_judge = make_genai_metric_from_prompt(
    name="business_impact",
    judge_prompt=business_impact_prompt,
    model="endpoints:/databricks-gpt-5"
)

# Use in evaluation
results = mlflow.evaluate(
    data=eval_data,
    model_type="databricks-agent",
    extra_metrics=[business_impact_judge]
)
Databricks has significantly improved LLM judges through active collaboration between research and engineering teams, with the improved judge automatically available to all customers.
Performance Optimization and Best Practices
Optimization Strategies
Token Usage Optimization:
- Minimize prompt verbosity while maintaining clarity
- Cache frequently used context to avoid redundant processing
- Implement streaming responses to reduce perceived latency
- Use function calling instead of verbose tool descriptions
Trace Management:
- Set appropriate sampling rates for high-volume endpoints
- Use trace filtering to focus on errors or slow requests
- Archive historical traces in cold storage after 90 days
- Aggregate metrics rather than storing every trace indefinitely
Cost Control:
- Monitor token consumption per agent component
- Set budget alerts in the Databricks workspace
- Use smaller models for simple routing decisions
- Implement request throttling for non-critical workloads
Do’s and Don’ts
Do’s | Don’ts |
Enable MLflow tracing from day one | Wait until production to add observability |
Register all agent versions in Unity Catalog | Deploy agents without version control |
Use LLM judges for continuous evaluation | Rely solely on user complaints for quality signals |
Set up inference tables before launch | Try to add monitoring after incidents occur |
Document data lineage and access patterns | Assume compliance without audit trails |
Create evaluation datasets from production traffic | Use only synthetic test data |
Monitor costs and set budget alerts | Assume token costs are negligible |
Implement gradual rollout with aliases | Deploy directly to production without staging |
Future Trends and Roadmap
Evolution of Agent Governance
The agent governance landscape is rapidly evolving:
Multi-Agent Orchestration Observability: As agents become more complex with dozens of specialized sub-agents, tracing and debugging these intricate workflows will require advanced visualization and analysis tools. Expect graph-based trace visualization and automated bottleneck detection.
Automated Governance Policies: Future systems will automatically enforce governance policies—automatically flagging agents that access unauthorized data, exceed cost thresholds, or violate quality standards before deployment.
Real-Time Quality Monitoring: MLflow Tracing enables capturing and monitoring key operational metrics such as latency, cost, including token usage, and resource utilization at each step of application execution. Future iterations will provide real-time alerting when quality degrades or costs spike.
Cross-Platform Lineage: As organizations deploy agents across multiple platforms (Databricks, cloud services, on-premise systems), unified lineage tracking across these boundaries will become essential.
Agent-Specific Compliance Frameworks: Regulatory bodies are beginning to address AI agents specifically. Unity Catalog provides comprehensive governance capabilities with democratized dashboards and granular governance information that can be directly queried through system tables. Expect purpose-built compliance reporting for AI agents.
Continuous Learning Infrastructure: Production agents will increasingly incorporate feedback loops where LLM judges, human ratings, and business metrics automatically trigger retraining or prompt optimization workflows.
Community and Research Developments
The Databricks community and broader ML community are actively advancing agent governance:
- MLflow 3 enhancements for better agent support and tracing
- Unity Catalog federation enabling governance across data platforms
- Advanced LLM judge research improves evaluation accuracy
- Open-source contributions to LangGraph, LangChain tracing integration
- Industry standards for AI agent governance are merging from organizations like NIST
For the latest developments, monitor:
Conclusion
Production-ready AI agents require a comprehensive governance infrastructure. Databricks delivers this through MLflow tracing for execution observability, Unity Catalog for access control and lineage, inference tables for production monitoring, and LLM-as-a-Judge for quality assessment.
By implementing these governance practices from the start, you transform experimental agents into enterprise-grade systems that are auditable, debuggable, cost-optimized, and continuously improving. Remember: governance isn’t an afterthought—it’s the foundation for scaling AI agents with confidence.