High-performing BI organizations don’t happen because of great dashboards alone — they emerge when Data Engineers, Power BI Developers, and Business Analysts work from a shared operating model. That model defines who owns data, how KPIs are standardized, and how insights move from raw sources to business decisions.
In regulated industries like healthcare, this alignment is critical. BI teams aren’t just answering questions — they’re supporting decisions that impact patient outcomes, financial accuracy, regulatory compliance (HIPAA), and operational efficiency. A small metric inconsistency or delayed pipeline can cause real-world consequences.
This blog presents proven BI design patterns that align engineering, modeling, and analytics into a repeatable, scalable delivery engine — using healthcare examples that easily translate to other industries.
BI Architecture Overview:
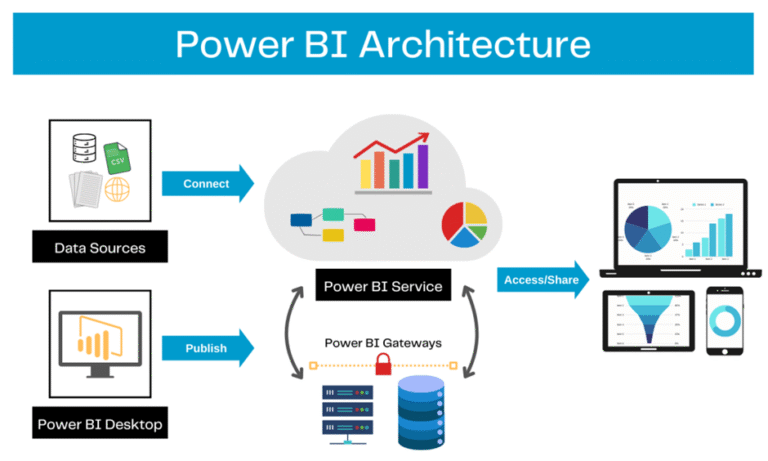
This architecture highlights:
- Data Engineering → stable, governed Gold data
- Semantic Modeling → reusable metrics and security
- Analytics → trusted dashboards and self-service
Governance and metadata sit across all layers, not as an afterthought.
Implementation with practical examples/use cases
Below are the patterns to implement, plus real scenarios showing how they play out in healthcare.
A. Layered architecture pattern (the core pattern)
Split responsibilities into three layers — each with clear owners and outputs:
1) Data Engineering Layer — Source to Gold
Owners: Data Engineers / ETL team
Responsibilities:
- Ingest sources (EHR/HL7, claims, ERP, third-party feeds).
- Provide conformed, de-duplicated, typed “Gold” tables at reporting grain (Fact_Admissions, Fact_Claims, Dim_Patient).
- Implement DQ checks, SCD handling, and incremental loads.
- Publish table-level lineage, freshness, and SLAs.
Healthcare scenario: Ingest Epic admissions, map patient IDs to Dim_Patient with SCD2 for demographic changes, mask PHI fields (SSNs) in staging, produce Fact_Admissions with admission_time, discharge_time, diagnosis_codes.
Practical outputs:
- Gold table contract: columns, type, grain, refresh cadence, owner.
- DQ report (daily) with acceptance thresholds.
2) Semantic Modeling Layer (Power BI dataset) — Contracts & Measures
Owners: Power BI Developers / BI devs
Responsibilities:
- Create certified semantic datasets: relationships, hierarchies, standardized measures (DAX), RLS/OLS, aggregation tables.
- Package dataset contract: which measures exist, their DAX, and default filters.
- Implement incremental refresh and aggregations for performance.
Healthcare scenario: A certified “Quality Metrics” dataset that defines Readmission Rate, Average Length of Stay, Infection Rate, with RLS so unit managers see only their wards. Measures are documented in the KPI registry.
Practical outputs:
- Certified PBIX / dataset with versioning, measure definitions, RLS rules, and usage telemetry.
3) Analytics Layer (Reports & Self-Service) — Business consumption
Owners: Analysts, Report Authors
Responsibilities:
- Build dashboards/pages, bookmarks, narratives, and guided analyses.
- Consume certified datasets rather than re-creating logic.
- Perform UAT with business users.
Healthcare scenario: A “Clinical Quality” dashboard that uses the certified dataset, provides drill-through from readmission KPI to patient-level events (anonymized), and includes explanatory text about the measure.
Practical outputs:
- Approved dashboards, report-level documentation, and annotated visuals.
B. Shared Metadata Repository — Killing Metric Drift
A KPI Registry prevents “definition chaos”.
What it contains
- KPI name & description
- Business rule
- DAX expression
- Owner & approver
- Version & effective date
- Sensitivity (PHI/PII)
Example
When CMS updates the Readmission Rate definition,
It’s updated once, and every certified dataset inherits it.
Result: zero KPI ambiguity.
C. Collaboration workflow (concrete rhythm)
A practical cadence to keep things aligned:
- Intake (Analyst): Define business need, KPI, grain, mock visuals — submit as a ticket with fields from metadata template.
- Feasibility (Data Engineer): Confirm source availability/quality and map to Gold tables.
- Pipeline (Data Engineer): Build ETL; publish Gold tables with SLA and DQ report.
- Semantic layer (BI dev): Build the dataset, implement measures and RLS, publish certified dataset.
- Reports (Analyst): Build dashboards, perform UAT with business users.
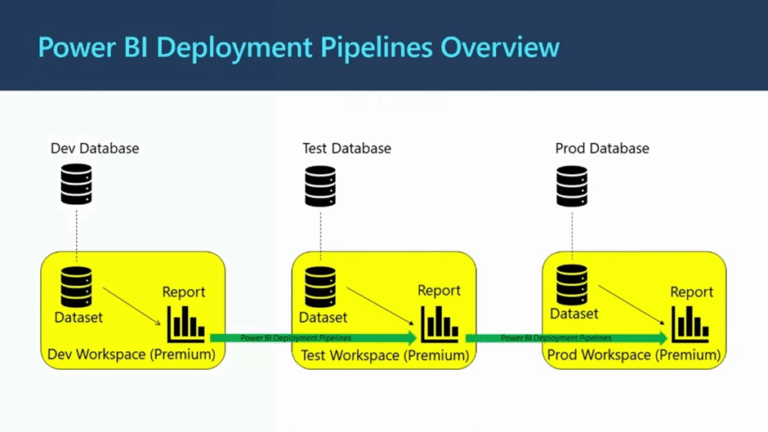
- Release: Dev → Test → Prod via CI/CD pipeline.
- Operate: Monitor refresh, usage; backlog items from telemetry.
Example: An analyst asks for a “Readmissions dashboard for cardiology.” Intake captures measures, filters, and determines who needs access. Data team confirms availability of readmission flags; BI dev adds a new DAX measure to the certified dataset; analyst builds dashboard, and UAT reveals a filter mismatch — fixed in the dataset and then republished.
D. Practical use cases with steps and examples
Below are applied examples showing how to implement the pattern end-to-end.
1) Patient throughput & bed management — near real-time needs
Problem: Bed occupancy needs near-real-time reads for operational decisions.
Solution steps:
- Engineering: build Fact_BedOccupancy with hourly grain; use streaming or frequent micro-batches.
- Semantic: create an aggregated hourly view and a lighter dataset for operations with fewer columns and pre-aggregated metrics.
- Analytics: dashboards use the operational dataset for live cards, while managers use the certified semantic dataset for strategic trends.
Outcome: Responsive operational UX without bloating strategic datasets.
Key features & benefits (concrete wins)
- Role clarity → fewer duplicated transformations.
- Consistency by design → shared KPI registry avoids metric drift.
- Performance & scalability → star schemas, aggregations, incremental refresh reduce costs and improve interactivity.
- Governed self-service → certified datasets + RLS/OLS let analysts explore safely.
- Operational reliability → CI/CD, refresh health dashboards, telemetry, and alerting.
- Regulatory safety → centralized PHI masking and sensitivity policies.
Operational checklist — how to roll this out in 8 weeks (practical plan)
Week 1 — 2: Governance & discovery
- Assemble stakeholders; define KPI registry template.
- Identify the top 10 mission-critical KPIs.
Week 3 — 4: Engineering stabilization
- Harden ETL for the top 3 source systems, implement DQ checks, and incremental loads.
- Publish Gold tables and lineage.
Week 5: Semantic modeling
- Build a certified dataset for those KPIs with documented DAX.
- Add RLS/OLS where needed.
Week 6: Reporting & UAT
- Analysts build dashboards from a certified dataset and conduct UAT.
Week 7: CI/CD and monitoring
- Set up pipelines and refresh monitoring; deploy to Test.
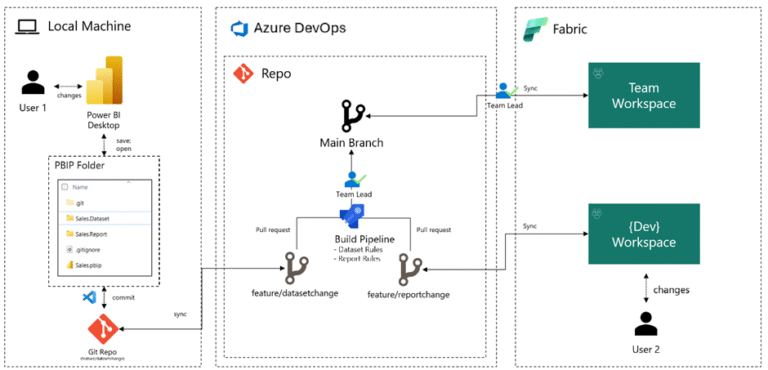
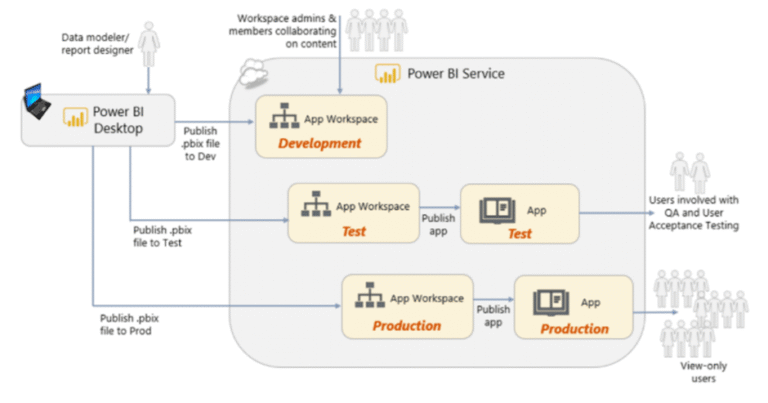
CI/CD & Deployment Pipeline
Development Pipeline: From Local Machine to Azure DevOps and Fabric
Dev → Test → Prod Pipeline Flow
Week 8: Go-live & feedback loop
- Release to Prod, train users, collect telemetry, and business feedback.
Governance and change control — short practical rules
- All KPI changes go through the registry. Any change must have a version, owner approval, and an effective date.
- Dataset changes are pull requests. DAX changes require code review and a test plan.
- Emergency hotfixes are logged. Hotfixes must be reviewed post-release.
- Telemetry drives backlog. Low usage visuals are deprecated after a review cycle.
Examples of useful artifacts you should maintain
- KPI Registry (CSV/DB table) — name, definition, DAX, owner, sensitivity, version.
- Dataset contract (markdown) — relationships, default filters, aggregations.
- DQ report — daily/weekly with problem rows and owner.
- Deployment playbook — steps for Dev→Test→Prod and rollback.
- On-call runbook — who to notify if the dataset refresh fails.
Common pitfalls and how to avoid them
- Pitfall: Analysts keep copying source transforms into visuals.
Fix: Make certified datasets accessible and reward reuse (catalog + discoverability). - Pitfall: No one owns the KPI.
Fix: Registry enforces an owner and an effective date. - Pitfall: Datasets grow too large.
Fix: Enforce aggregation tables, remove unused columns, and set dataset caps. - Pitfall: PHI leaks in self-serve.
Fix: Centralize masking, enforce OLS, and audit dataset access.
Conclusion
Turning BI into a high-performance, reliable function requires three things: architectural separation, a single source of truth for metrics, and a disciplined collaboration rhythm. The layered architecture pattern — engineering → semantic → analytics — plus a KPI registry and CI/CD pipeline will remove most friction points. In healthcare, this approach protects patients and compliance while delivering faster, more confident decision-making.
Start small: pick 3 high-impact KPIs, build Gold tables for them, implement the semantic layer, and publish a certified dataset. Use telemetry and the KPI registry as your steering wheel. Over time, the benefits compound — fewer emergency fixes, consistent KPIs, and dashboards people trust.