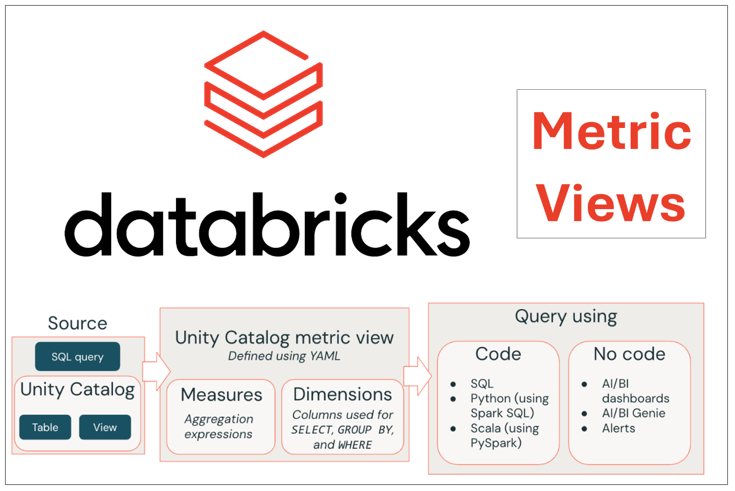
Metric Views in Databricks Unity Catalog are a powerful way to create consistent, reusable business metrics, making it easy for teams to analyze key performance indicators (KPIs). They’re like a shared recipe book for your data—define your metrics once, and everyone can use them in queries, dashboards, or reports without writing complex code. In this beginner-friendly guide, we’ll create a simple Metric View using an example dataset, query it, and show the results. We’ll also cover common challenges, including limitations from Databricks documentation, to help you succeed in your analytics journey.
What Are Metric Views?
Metric Views let you define business metrics in one place using Databricks Unity Catalog, ensuring everyone gets the same results for KPIs. Think of them as a calculator that does the hard math for you, so you can focus on analyzing data instead of writing tricky SQL.
Key Components:
• Dimensions: Labels to group or sort your data, like “region” or “year.” They’re like tags
on your data.
• Measures: Numbers you calculate, like “total count” or “average score.” These are your KPIs.
• Source: The main table with your data, sometimes joined with other tables for extra details.
Why Use Metric Views?
• Consistency: Everyone uses the same metric logic, avoiding mistakes.
• Reusability: Define once, use in SQL, dashboards in Databricks.
• Simplicity: Hides complex calculations, making analytics easy for beginners.
Example Dataset
To illustrate, we’ll use three tables:
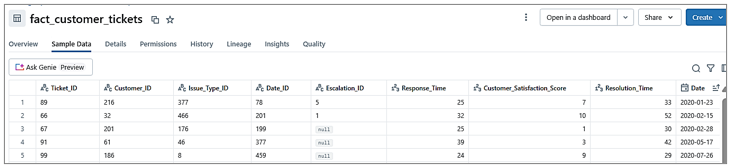
- fact_customer_tickets: Tracks support tickets.
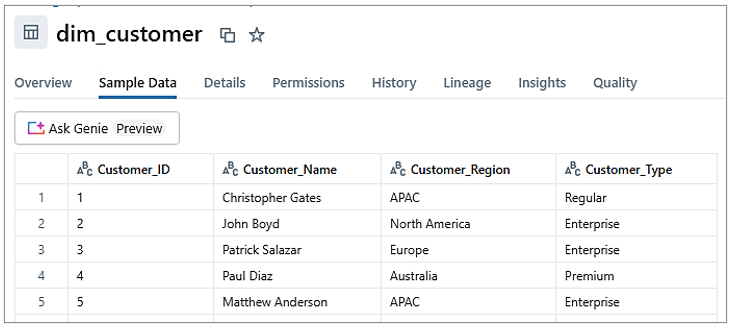
2. dim_customer: Customer details.
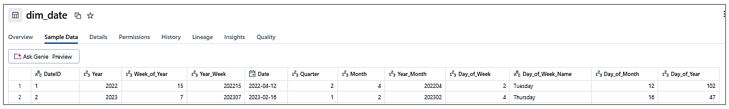
3. dim_date: Date information.
Creating a Metric View
We’ll create a Metric View to analyze data by region and year, joining fact_customer_tickets with dim_customer and dim_date. It will include:
• Dimensions: Customer_Region (with NULL handling) and Year.
• Measures: Total_Tickets (count of unique tickets) and Average_Satisfaction_Score.
YAML Script
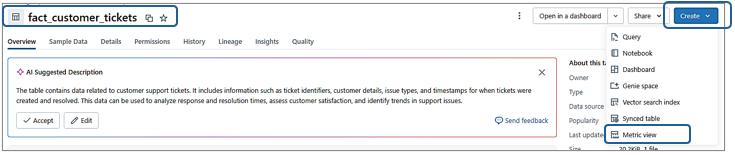
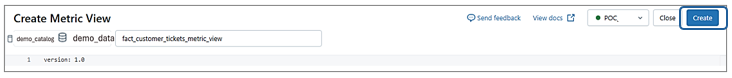
In Databricks, go to Catalog Explorer, select fact_customer_tickets
(demo_catalog.demo_data.fact_customer_tickets)
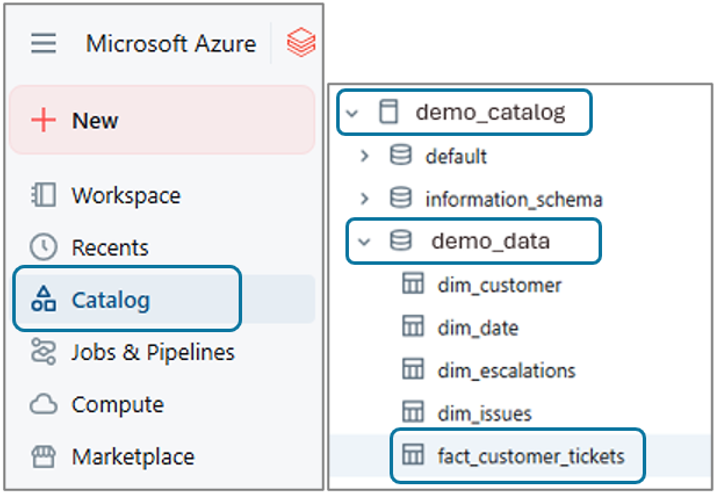
and click Create > Metric View to open the YAML editor.
Now, Databricks provides a default YAML script based on the table’s columns:
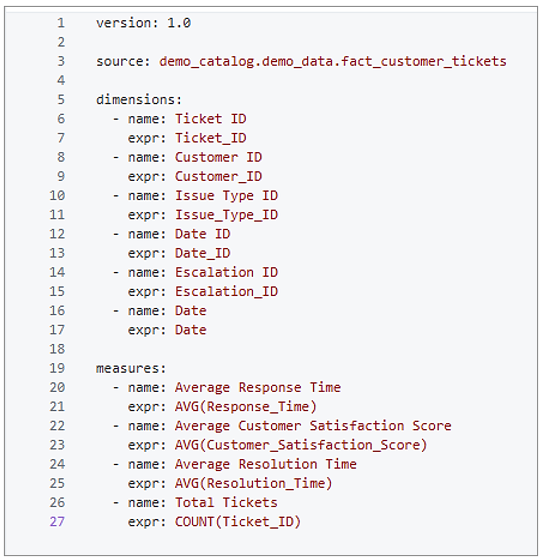
What This Does:
• Dimensions: Includes all columns from fact_customer_tickets as dimensions (e.g.,Ticket_ID, Customer_ID).
• Measures: Creates averages for numeric columns (Response_Time, Customer_Satisfaction_Score, Resolution_Time, and a count for Ticket_ID.
• Limitations: No joins to dimension tables (e.g., dim_customer), and some dimensions (e.g., Ticket_ID) may not be useful for grouping.
Customizing the Metric View:
• The default YAML is a starting point, but we need specific metrics, like analyzing tickets
by Region and Year. We’ll modify it to include joins to dim_customer and dim_date, and
focus on useful dimensions and measures.
Custom YAML Script
• Here’s the customized YAML for our needs:
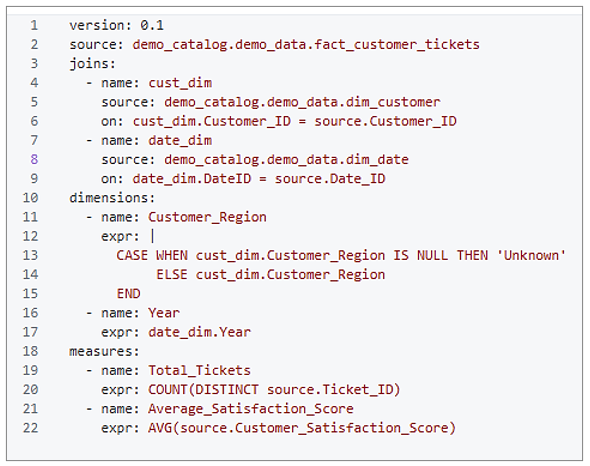
Explanation:
• source: The fact_customer_tickets table.
• joins: Links to dim_customer (via Customer_ID) and dim_date (via Date_ID) for extra details.
• dimensions:
1) Customer_Region handles NULLs with a CASE statement.
2) Year pulls from dim_date.Year.
• measures:
1) Total_Tickets counts unique tickets.
2) Average_Satisfaction_Score averages satisfaction scores.
Saving the Metric View:
1. Write the custom YAML script in the editor based on your requirements, as shown
above.
2. Click Create to save the Metric View as fact_customer_tickets_metric_view in
Catalog Explorer. Ensure the YAML is correctly formatted (e.g., 2-space indentation) to
avoid errors.
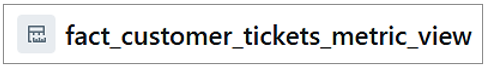
After creation, the Metric View appears in Catalog Explorer under Data > demo_catalog.demo_data marked by a distinctive Metric View icon (a chart-like symbol) as shown in the image below, making it easy to identify among other tables and views.
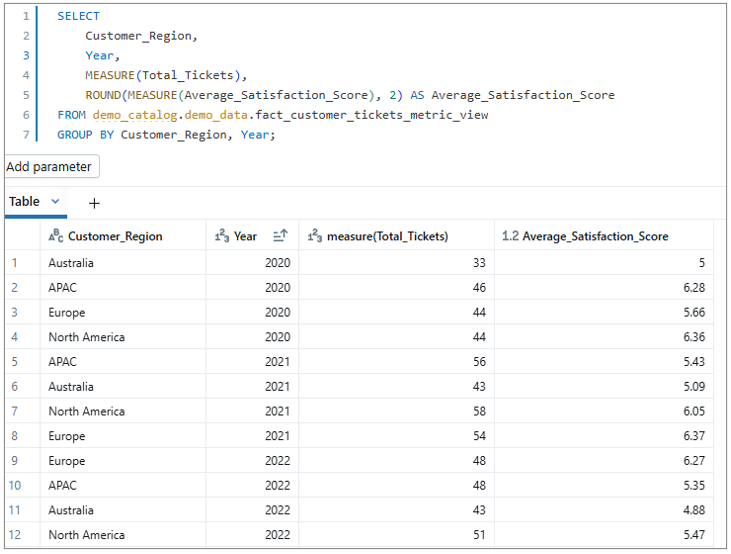
Querying the Metric View:
Query Metric Views in the Databricks SQL editor like a table, but follow these rules:
- Use MEASURE() for measures (e.g., MEASURE(Total_Tickets)).
- Group by dimensions (e.g., Customer_Region, Year).
- Avoid SELECT * or re-aggregating measures (e.g., SUM(MEASURE(Total_Tickets))).
Example Query & Output:
To understand what’s happening behind the scenes, here’s the standard SQL equivalent and its output:
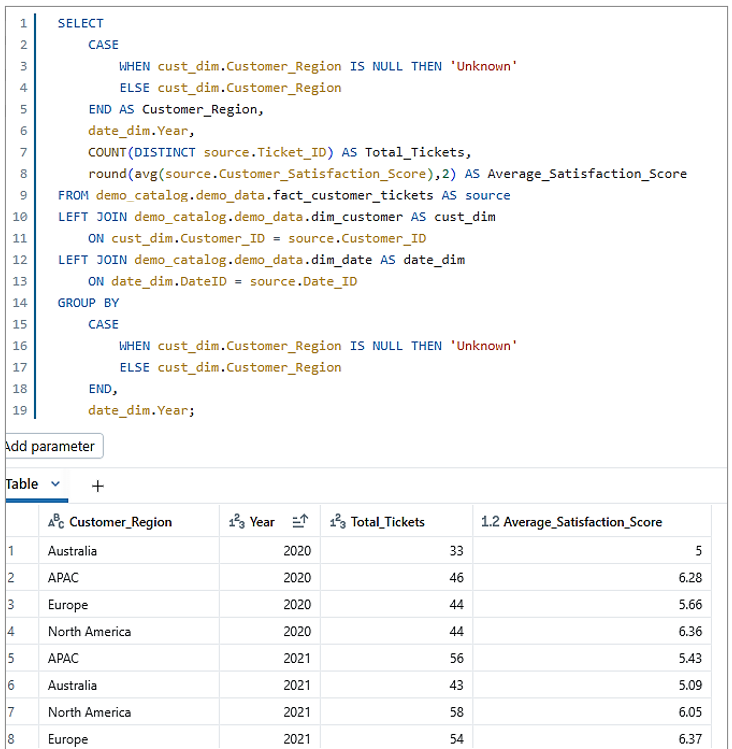
- Understanding the Logic: Reveals the underlying SQL (joins, aggregations) that the Metric View abstracts, helping beginners grasp how it works.
- Learning SQL: Bridges the gap for users new to SQL, showing how YAML dimensions and measures translate to standard SQL syntax.
- Debugging: Allows comparison between Metric View and SQL results to troubleshoot errors in YAML or data.
- Flexibility: Demonstrates how to replicate Metric View logic in environments without Metric Views or for custom queries.
- Transparency: Clarifies the calculations (e.g., COUNT(DISTINCT)), ensuring users trust the Metric View’s output.
- Optimization Insights: Exposes the SQL execution plan (e.g., join types, aggregations), enabling users to identify performance bottlenecks and optimize queries by adding filters or indexes in the YAML or source tables.
- Education: Teaches best practices (e.g., handling NULLs with CASE) for writing robust SQL queries
Common Challenges and Solutions:
Here are key challenges, including limitations from the Databricks documentation, with beginner-friendly solutions:
- No Support for Delta Sharing, Monitoring, or Data Classification:
- Challenge: You can’t share Metric Views via Delta Sharing, use them in Lakehouse Monitoring, or apply Data Classification (Beta).
- Solution: Use Metric Views within Databricks for queries and dashboards. Export results as CSV for sharing.
2. No Query-Time Joins:
- Challenge: You can’t join Metric Views with other tables in queries; joins must be in the YAML.
- Solution: Define joins (e.g., dim_customer, dim_date) in the YAML, as shown. Use CTEs for extra query logic.
3. SELECT * Not Supported:
- Challenge: SELECT * fails on Metric Views.
- Solution: Always select specific dimensions and measures (e.g., Customer_Region, MEASURE(Total_Tickets)).
4. No Re-Aggregation of Measures:
- Challenge: Queries like SUM(MEASURE(Total_Tickets)) are not allowed.
- Solution: Use MEASURE(Total_Tickets) directly without extra aggregations.
5. No MAP Type Columns in Joins:
- Challenge: Joined tables can’t have MAP type columns.
- Solution: Ensure joined tables (e.g., dim_customer) use standard types like STRING or INTEGER.
No Mixing Windowed and Base Fields:
- Challenge: You can’t combine windowed measures (e.g., year-on-year ticket growth) with basic aggregations (e.g., COUNT(source.Ticket_ID)) in one MEASURE expression, as it risks incorrect results.
- Solution: Define separate measures in the YAML, like Total_Tickets: COUNT(source.Ticket_ID) and
Last_Year_Tickets:
COUNT(source.Ticket_ID) WITH window: TRAILING 1 YEAR,
then use MEASURE(Total_Tickets) – MEASURE(Last_Year_Tickets).
- YAML Syntax Errors:
- Challenge: Wrong indentation (e.g., using tabs) breaks the Metric View.
- Solution: Use 2-space indentation and validate YAML before saving.
2. NULL Values in Joins:
- Challenge: NULLs in joined columns (e.g., Customer_Region) cause missing data.
- Solution: Use CASE statements, as in Customer_Region, to handle NULLs.
Best Practices
- Keep It Simple: Start with basic dimensions and measures, like in our example.
- Handle NULLs: Use CASE statements for joined dimensions (e.g., ‘Unknown’ for NULL regions).
- Use Filters: Add YAML filters (e.g., filter: Date >= ‘2025-01-01’) for faster queries.
- Set Permissions: Restrict access (e.g., GRANT SELECT ON fact_customer_tickets_metric_view to analysts).
- Test Queries: Run small queries to check results before building dashboards.
- Document Logic: Add YAML comments (e.g., # Count unique tickets) for clarity.
Why Metric Views Matter
Metric Views make analytics easier by:
- Letting beginners query KPIs without complex SQL.
- Ensuring consistent results across teams.
- Supporting dashboards in Databricks for visualizations.
Conclusion
Unlock the power of analytics with Metric Views in Databricks Unity Catalog! By transforming complex data into consistent, reusable KPIs—like tracking trends by region or year—you’ll save time, boost performance, and empower your team to make data-driven decisions with ease. Start building your own Metric Views today, and transform your analytics into clear, consistent insights with ease!