What Are Databricks System Tables?
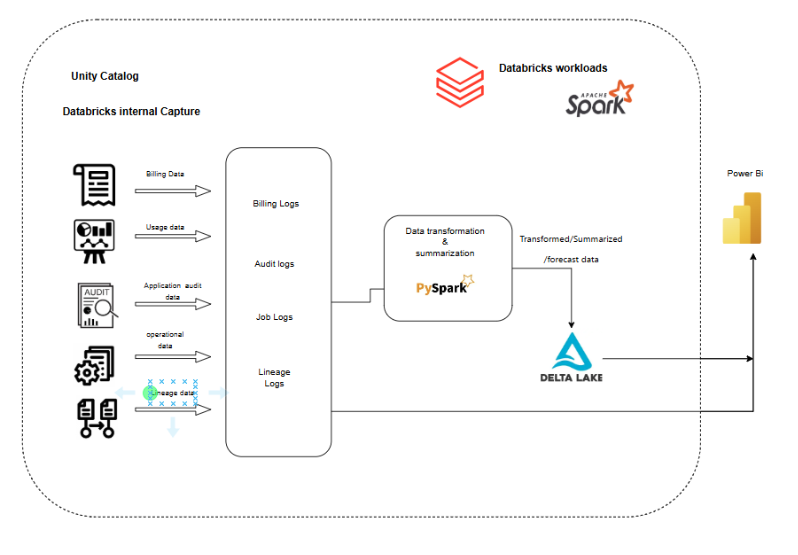
Databricks system tables are specialized metadata tables that provide insights into various aspects of your Databricks environment, including query execution, pipeline performance, and resource utilization. These tables are essential for monitoring, auditing, and optimizing your data workflows.
Understanding Query History
The system.query.history table logs all SQL queries executed across your Databricks workspaces. This includes queries run via SQL warehouses, notebooks, and jobs. By querying this table, administrators can: Query history system table reference | Databricks Documentation
- Identify long-running or failed queries.
- Monitor user activity and resource consumption.
- Audit data access and modifications.
Example Query:
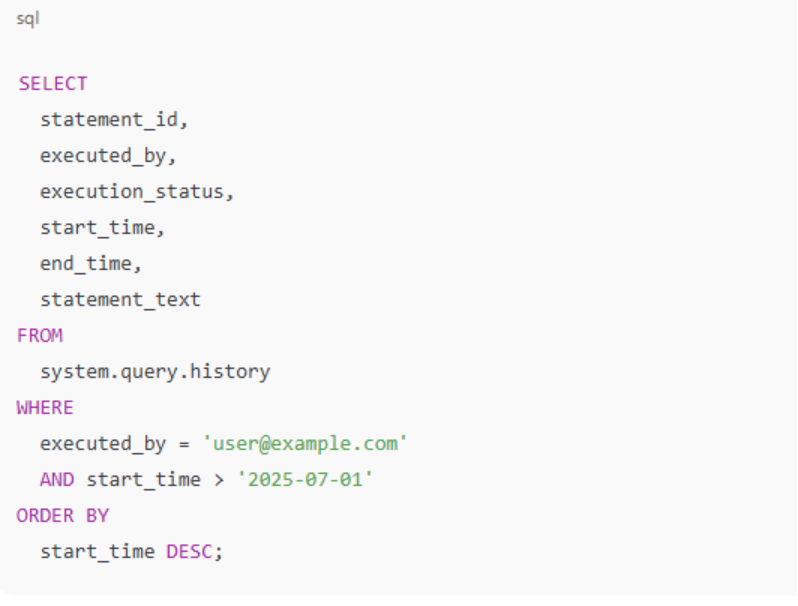
This query retrieves all queries executed by a specific user since July 1, 2025, providing insights into their activities and performance. Query history system table reference | Databricks Documentation
Monitoring Pipeline Costs
Databricks provides the system.billing.Usage table to track the cost associated with various workloads, including Delta Live Tables (DLT) pipelines. This table records DBU (Databricks Unit) consumption, allowing organizations to: Databricks Documentation
- Identify cost drivers.
- Optimize resource allocation.
- Forecast future expenses. Monitor costs using system tables | Databricks Documentation
- Enhance Lakehouse Security with Databricks | Databricks Blog
Example Query:
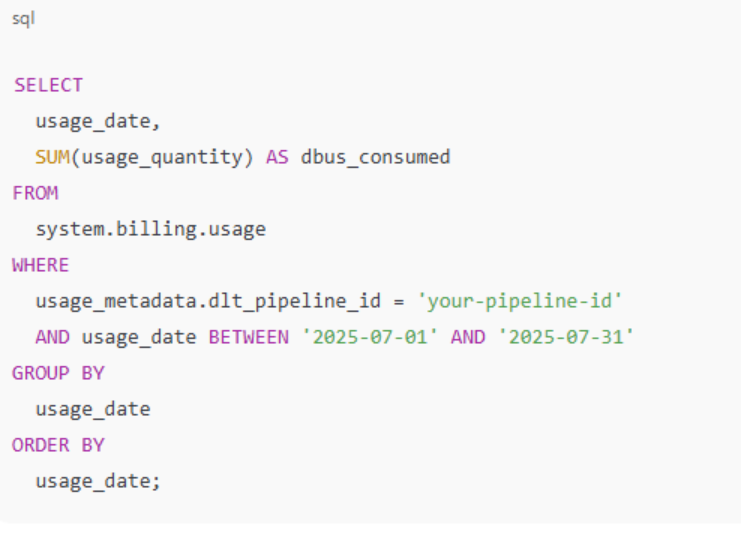
This query calculates the daily DBU consumption for a specific DLT pipeline during July 2025, aiding in cost analysis and optimization. Databricks Documentation
Analyzing Compute Usage
The system.billing.usage table also captures compute resource utilization, including clusters, SQL warehouses, and serverless compute. By analysing this data, organizations can: Monitor costs using system tables | Databricks Documentation
- Determine the most resource-intensive workloads.
- Optimize cluster configurations.
- Ensure efficient use of resources.
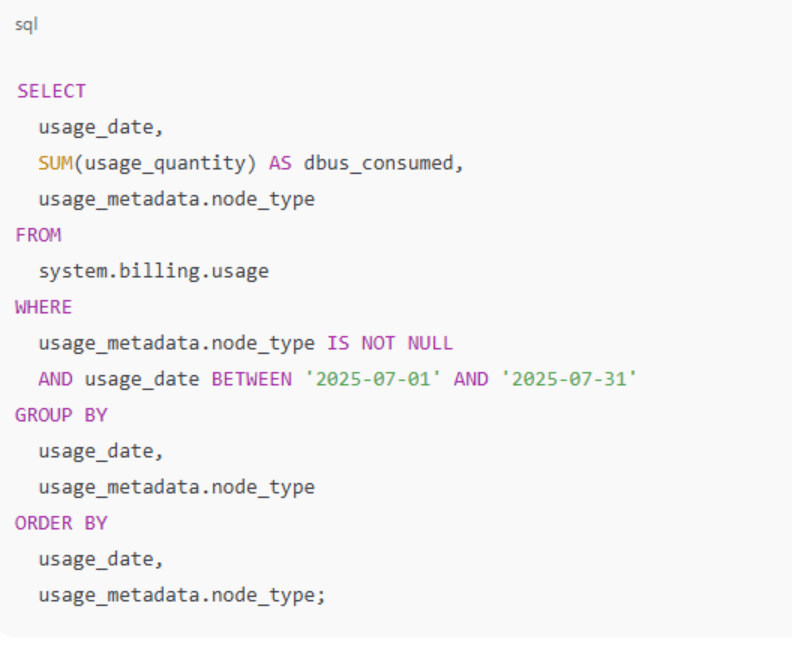
This query provides a daily breakdown of DBU consumption by node type, helping identify which instance types are most cost-effective. Databricks Documentation
Best Practices for Managing System Tables
To effectively leverage Databricks system tables:
- Access Control: Restrict access to system tables to authorized users only.
- Data Retention: Implement policies to archive or purge old data to maintain performance.
- Regular Audits: Schedule periodic reviews of system table data to identify anomalies or inefficiencies.
- Automation: Automate the extraction and analysis of system table data for continuous monitoring.
System Tables:
Table | Description |
system.access.audit | Regional audit logs: monitors user activity and service events. |
system.access.table_lineage & column_lineage | Tracks data read/write lineage at table and column levels. |
system.billing.usage | Global DBU usage by hour, workspace, SKU, and compute resource. |
system.billing.list_prices | SKU list prices (Type-2 SCD): supports historical pricing queries. |
system.compute.clusters, node_types, node_timeline | Historical and real-time cluster and node metadata, used for cost/performance analysis. |
system.compute.warehouses, warehouse_events | Logs SQL warehouse details and scaling events. |
system.lakeflow.* tables | Pipeline/job metadata and execution timelines. |
Others: | Predictive optimization, assistant usage, network access events, and more |
Conclusion
Databricks system tables are powerful tools for gaining visibility into your data workflows, monitoring performance, and optimizing costs. By effectively utilizing these tables, organizations can ensure efficient and cost-effective operations within the Databricks environment.
Power BI Integration Example
To visualize and analyse Databricks system table data in Power BI:
- Connect Power BI to Databricks:
- Use the Databricks ODBC or JDBC connector to establish a connection between Power BI and your Databricks workspace.
- Import System Table Data:
- Query the desired system tables (e.g., system.query.history, system.billing.usage) within Power BI to import the data.
- Create Visualizations:
- Utilize Power BI’s visualization tools to create dashboards and reports that provide insights into query performance, cost analysis, and resource utilization.
This integration allows for real-time monitoring and analysis of your Databricks environment within Power BI.