
Anyone working with Power BI, Excel, or any Microsoft tools will be familiar with its formula language – DAX (Data Analysis Expression). This language is used to define calculations and queries on the data models, playing a key role in transforming raw data into insightful visualizations and reports. However, those who use DAX regularly will agree that it is a very complex language to master and understand.
DAX provides a wide array of powerful functions for filtering, calculating, and manipulating data. It is incredibly flexible and can handle various tasks, from basic sums and averages to more advanced business logic and time intelligence calculations. But this very flexibility makes it a challenge for users to fully grasp its behaviour and nuances. In fact, understanding DAX context, filtering behaviour, and evaluation context often becomes the key to writing effective formulas and getting the desired results.
The Challenge:
Developers working with DAX often find it difficult to understand how their formulas are working and why their calculations aren’t returning the expected results. This becomes especially frustrating when dealing with complex business logic or nested DAX functions. Errors may arise in different contexts, depending on slicers, filters, or the relationships between tables, making it challenging to pinpoint exactly where things are going wrong.
Many users have spent hours debugging their DAX formulas, trying to identify why the code is not behaving as expected and this is a time-consuming task.
The Solution:
One way to solve this challenge is to break down the code step by step to better understand what is going on. There are several techniques to debug the code –
- Debugging with the use of Variables
- Using DAX Studio
- Using DAX Debugger in Tabular Editor
In today’s blog, we will take a look at how we can debug the code using the DAX Debugger feature in Tabular Editor.
What is Tabular Editor?
Tabular Editor is a Windows desktop application used for building faster and better data models. It is built around the metadata of the model and comes in two versions – Tabular Editor 2.x (free) and Tabular Editor 3.x (Commercial). It has several advanced features such as creating calculation groups, OLS, partitions, and more. One of its most notable features is the DAX Debugger.
What is DAX Debugger?
The DAX Debugger is a feature that provides a way to interactively debug DAX queries and measures, making it easier to identify and fix issues in your data models. It recalculates a partial DAX expression so that you can evaluate step by step how the engine evaluates a single cell in a report.
Prerequisites:
- You must have Tabular Editor 3.
- It must be operated in connected or workspace mode.
How to Start the Debugger:
The debugger can be started in two ways:
- Through Pivot Grid
- Through a DAX query
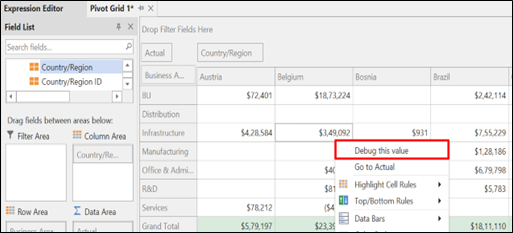
Through a Pivot Grid –- Open Tabular Editor and connect to your workspace and model, or open the PBIX file and click on Tabular Editor 3 under External Tools.
- Create a Pivot Grid in Tabular Editor 3 (File à New à Pivot Grid).
- Add the measure you want to debug into the Pivot Grid. You can also add fields under filters, columns, and rows.
- Right-click on the cell you want to debug and click on Debug this Value.
Through a DAX query –
- Open Tabular Editor and connect to your workspace and model, or open the PBIX file and click on Tabular Editor 3 under External Tools.
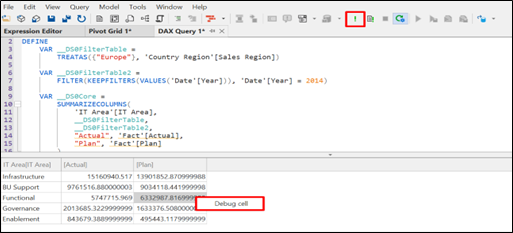
- Click on File à New à DAX Query.
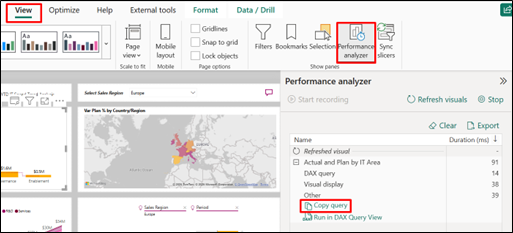
Type in or copy-paste your DAX query (you can get the DAX query of a visual using the Performance Analyser option in PBI).
- Press F5 or click the ! button to execute the query
- Right click on the cell you want to debug and click on Debug.
Once you click on Debug using either of the above methods, you will be able to see four views –
- Locals
- Watch
- Evaluation Context
- Call Tree
Views in the DAX Debugger:
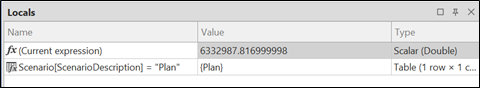
- Locals – This view provides a list of measures, columns, and variables used in the cell, along with their values.
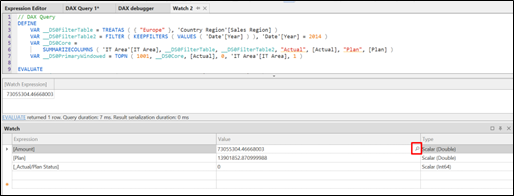
Watch – Allows you to enter any DAX expression, which will be calculated within the current evaluation context. You can simply drag and drop the measure you want to watch into the watch view. The magnifying glass symbol allows you to generate the query for the cell and opens a new DAX query that defines the context of the calculation, as well as the calculation itself, allowing you to inspect the results in more detail.
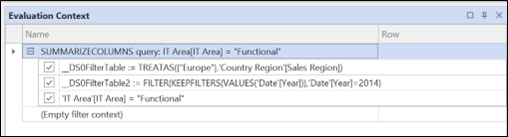
Evaluation Context – Shows the evaluation context in terms of all the filters applied.
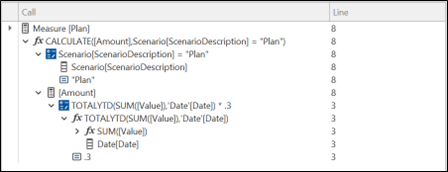
Call Tree – Provides a detailed outline of the entire calculation, making it easier to navigate between sub-expressions.
Limitations:
- Only a few DAX expressions are supported when debugging.
- Queries that contain implicit measures or query-scoped calculations are currently not supported.
- Visual calculations cannot be debugged.
- The debugger currently only allows debugging DAX expressions on measures.
Conclusion:
Debugging DAX formulas can be challenging, especially with complex models in Power BI. The DAX Debugger in Tabular Editor provides an efficient way to interactively debug DAX expressions, helping developers pinpoint errors faster. With features like Locals, Watch, Evaluation Context, and Call Tree, it simplifies the troubleshooting process, saving valuable time and improving formula accuracy. Despite its limitations, the DAX Debugger is an invaluable tool for anyone working with DAX, streamlining the debugging process, and enhancing productivity.