
Introduction:
In today’s data-driven project environments, tracking work progress visually and in real time is no longer a luxury—it’s a necessity. Microsoft Planner serves as a great tool for managing team tasks and priorities, but when it comes to analytics, it hits a wall: there’s no native connector to Power BI.
That’s where Power Automate steps in. With this low-code automation platform, we can bridge Planner and Power BI by extracting Planner data into structured Excel tables hosted in SharePoint. From there, Power BI can pull data for rich visual analytics.
This blog walks through the complete automated solution and helps you unlock Planner insights in Power BI—cleanly, efficiently, and without manual exports.

Problem Statement:
While Planner is excellent for managing daily workstreams, its analytical capabilities are limited:
- No direct Power BI connector for Planner.
- Manual exports are time-consuming and error-prone.
- Task-level data is hard to query and compare across teams.
The core challenge: How can teams perform meaningful analysis on Planner task data, such as user workload, bucket progress, overdue items, and checklist statuses?
The goal: Automate Planner data collection using Power Automate, store it in Excel tables on SharePoint, and create a refreshable Power BI report that visualizes this data.
Implementation with Practical Use Case:
Use Case: Daily Task Analytics for a Cross-Functional Team
Let’s say your project team uses multiple Planner boards to manage tasks. You want to create a Power BI dashboard that shows:
- Tasks completed per user across all plans
- Checklist item completion rates
- Bottlenecks by overdue tasks
Flow Implementation:
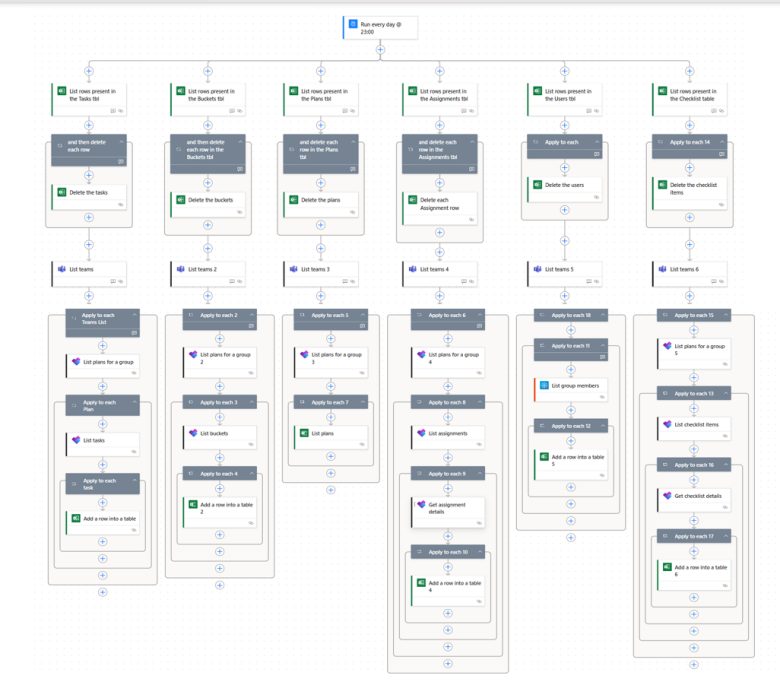
The Power Automate flow works as follows:
Step-by-Step Breakdown of the Power Automate Flow
Trigger: Daily Scheduled Execution
- When: The flow runs automatically every night at 11:00 PM IST.
- Why: This ensures the data in your Power BI report is refreshed daily with the latest Planner updates.
Step 1: Clean up Old Data from Excel
Before inserting new data, the flow clears out existing rows in all relevant tables to avoid duplication:
Excel Table | Action |
Tasks | List all rows → Delete all |
Plans | List all rows → Delete all |
Buckets | List all rows → Delete all |
Users | List all rows → Delete all |
Assignments | List all rows → Delete all |
Checklist | List all rows → Delete all |
This step resets the dataset before every load for clean ingestion in Power BI.
Step 2: Fetch Planner Data
Fetch All Planner Plans
- Action: Use List my plans to retrieve all the plans the signed-in user is part of.
- Note: Each plan will be looped through in the following steps.
Loop: For Each Plan
For every plan, perform the following actions:
- Get Plan Details
- Plan ID, Title
- List Buckets
- Retrieve all buckets linked to the current plan
- Store: Bucket ID, Name, Plan ID
- List Tasks
- Retrieve all tasks under the plan
- Store: Task ID, Title, Progress, Priority, Start/Due Dates, Assigned To, etc.
- List Group Members
- Get user metadata to enrich assignment mapping
- Store: User ID, Display Name, Email
- Loop Through Each Task
- Extract checklist items (if any)
- Store: Checklist title, status, task ID
- Loop Through Each Assignment
- Capture the relationship between tasks and assigned users
Step 3: Write Data into Excel Tables
Each Planner entity is mapped to a table:
Planner Entity | Excel Table | Key Fields Captured |
Plan Info | Plans | Plan ID, Plan Title |
Buckets | Buckets | Bucket ID, Bucket Name, Plan ID |
Tasks | Tasks | Task ID, Title, Progress, Priority, Start/Due Date, Plan ID |
User Info | Users | User ID, Display Name, Email |
Task Assignments | Assignments | Task ID, Assigned User ID |
Checklist Items | Checklist | Checklist Title, Status, Task ID |
All data is stored in an Excel workbook hosted on SharePoint, making it accessible to Power BI through a Web or OneDrive connector.
Step 4: Connect to Power BI
- Use Power BI Desktop to import the Excel file from SharePoint.
- Use Power Query to clean, transform, and model your data.
- Build visuals like:
- Tasks by user or bucket
- Overdue vs. completed tasks
- Checklist completion trends
Key Features & Benefits:
Feature | Benefit |
Daily automated refresh | Always up-to-date data—no manual exports |
Structured Excel storage | Easy to connect and model in Power BI |
Granular task-level access | Drill down into assignments, checklist status, due dates, and more |
Multi-user data handling | Analyze workloads across team members and plans |
Minimal permissions required | No admin access needed—works with user-level plan visibility |
Pre-Requisites & Conclusion
Pre-Requisites:
- Access to Microsoft Planner
- A licensed Power Automate account
- Excel file with pre-defined tables (hosted on SharePoint or OneDrive)
- Permission to access all relevant plans and tasks
- Basic familiarity with Power BI for visualization
Conclusion:
By creatively combining Power Automate, Planner, Excel, and Power BI, you’ve got a repeatable framework to build robust, real-time task dashboards. This approach enables decision-makers to visualize workload distribution, task progress, and project health—without ever leaving the Microsoft 365 ecosystem.